
Using a CoA for Malting and Brewing – Pt. 3
We work hard to produce consistent, quality malt. As part of this process, we send every batch to a third party lab which provides us with a full Certificate of Analysis (CoA). A recent review of a discrepancy in color, prompted an interesting discussion between the two laboratories that we use, Montana State University Malt Quality Laboratory and Hartwick College Center for Craft Food and Beverage. Cheers to Hannah (MSU) and Aaron (Hartwick) for the their thoughts and edits on this post!
To provide some background, each component of the CoA has a standardized methodology associated with it that was developed and approved by the American Society of Brewing Chemists (ASBC). All laboratory testing follows these guidelines. However, different equipment, staff, and testing conditions can lead to variations in results.
How do our intrepid scientists address this potential problem you ask?
They employ rigorous internal and external quality practices to ensure both precision and accuracy in test results. . These include 1) participation in the ASBC Lab Proficiency Program – regular testing of blind samples with comparison of results across 19 labs from the US and Canada and. 2) daily in house control charting to catch any inconsistencies on the spot.
It is important to note that this level of effort helps define and control the acceptable levels of variability within each lab, but does not eliminate it!
Let’s look at a few examples that illustrate this point…..
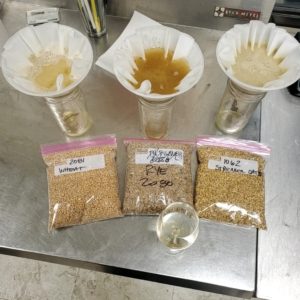
- Color – As we’ve grown, consistency in this department has become paramount. Brewers (and their customers!) have expectations regarding the color of their finished products. If we miss in this department, problems can arise quickly. Note that a normal difference between labs can be up to 0.6 SRM. Given this information, we typically allow for a swing of 0.5 SRM in our base malts.
- Extract – Another “hot button” topic for larger breweries. Lower extract/efficiencies equals lost revenue at a measurable scale. A variability of 1.4% could mean the difference between winning a contract or making a price concession. We have recently updated our specifications on the website to reflect a “minimum” rather than an absolute percentage to reflect this reality.
Understanding and accepting this variability comes with the territory of working with an agricultural product. Definitely something for both maltster and brewer to keep in mind when discussing final results!
If you are interested in learning more about this topic, The North American Craft Maltsters Guild is hosting a Malt Analysis webinar on March 25th!
https://craftmalting.com/events/member-webinar-meaningful-malt-analysis/
The typical variation for the most common malt tests are listed below:
The “repeatability” (r95) is the maximum expected difference between two test results on the same sample from the same lab.
The “reproducibility” (R95) is the maximum expected difference between two test results on the same sample from different labs.
| r(95)(within lab) | R(95)
(between lab) |
|
| Moisture (%) | 0.2 | 0.8 |
| Extract (%, dm) | 0.4 | 1.4 |
| Beta Glucan (mg/L) | 20 | 50 |
| Friability (%) | 3.0 | 7.0 |
| Soluble Protein (%, dm) | 0.2 | 0.6 |
| Total Protein (%, dm) | 0.2 | 0.4 |
| FAN (mg/L) | 7.0 | 40 |
| Colour (°ASBC) | 0.2 | 0.6 |
| Diastatic Power (°L) | 10 | 30 |
| Alpha Amylase (DU) | 5.0 | 15 |